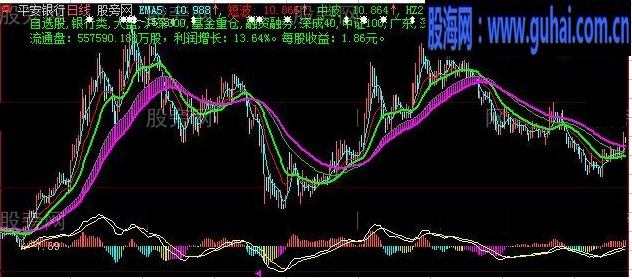
中短波上涨买入主图指标公式
-
相关简介:中短波上涨买入主图指标公式 DRAWTEXTABS(30,0,BKNAME ),COLORGREEN; DRAWTEXTABS(30,15,'流通盘:'+CAPITAL/100+'万股,利润增长:'+FINANCE2(10)+'%。每股收益:'+FINANCE2(3)+'元。' ),COLORGREEN; EMA5:MA(C,5),linethick1,COLORFFFF00; 主线:=(ma(close,6)+ma(close,12)+ma(close,24)+ma(close,36))/4;
-
文章来源:股海网作者:股海网发布时间:2014-04-11浏览次数:

中短波上涨买入主图指标公式
DRAWTEXTABS(30,0,BKNAME ),COLORGREEN;
DRAWTEXTABS(30,15,'流通盘:'+CAPITAL/100+'万股,利润增长:'+FINANCE2(10)+'%。每股收益:'+FINANCE2(3)+'元。' ),COLORGREEN;
EMA5:MA(C,5),linethick1,COLORFFFF00;
主线:=(ma(close,6)+ma(close,12)+ma(close,24)+ma(close,36))/4;
股价重心:=dma(amount/vol/100,vol/capital);
ma14:=ema(close,14);
ma34:=ema(close,26);
ma54:=ema(close,54);
ma90:=ema(close,90);
{中短波}
hz:=ema(close,13);
短波:ema(hz,1),colorred,linethick1;
中波:ema(hz,26),color00dd00,linethick1;
均线148天:=ema(c,148);
成本:=sum(amount,0)/sum(vol,0)/100;
hz2:ema(hz,8),colorgreen,linethick2;
hz4:ema(hz,39),colorff00ff,linethick2;
a3:stickline(中波>hz4,中波,hz4,2,1),colorff00ff;
{慢速kdj}
rsv:=(close-llv(low,60))/(hhv(high,60)-llv(low,60))*100;
fastk:=sma(rsv,12,1);
k:=sma(fastk,9,1);
d:=sma(k,3,1);
j:=3*k-2*d;
{中波}
var11:=3*sma((close-llv(low,75))/(hhv(high,75)-llv(low,75))*100,20,1)-2*sma(sma((close-llv(low,75))
/(hhv(high,75)-llv(low,75))*100,20,1),15,1);
var22:=100-var11;
中势线:=(-1)*(ema(var22,1)-50)+42;
tz:=(close-llv(low,331))/(hhv(high,331)-llv(low,331))*100;
强势线:=sma(tz,5,1);
大盘线:=70*(hhv(high,39)-close)/(hhv(high,39)-llv(low,39));
{量选}
aa:=vol/sum(vol,13);
bb:=dma(c,aa);
cc:=vol/sum(vol,34);
dd:=dma(c,cc);
{背离}
var00:=winner(close);
var1:=forcast(var00,10);
var2:=ma(var1,3);
var3:=ma(var2,12);
var4:=ma(var3,16);
var5:=ma(var4,31);
var6:=ma(var5,55);
var7:=var5;
var8:=var4>var2*1.11 and var3>var2*1.095;
a:=var4/var2;
b:=var3/var2;
var9:=var2>var1*0.95;
td:=var2/var1;
var1h:=indexc;
var2h:=ma(var1h,6);
var3h:=ma(var1h,24);
var4h:=ma(var1h,32);
var5h:=ma(var1h,62);
var6h:=ma(var1h,105);
var7h:=var5h;
var8h:=var4h>var2h*1.11 and var3h>var2h*1.095;
var9h:=var2h>var1h*0.95;
pt:=(if(h=l and c=o and l=c and c>0 and ref(h,1)=ref(l,1) and ref(c,1)=ref(o,1)
and ref(h,1)=ref(c,1) and ref(c,1)>0,0,1))>0;
g:=(var7h and var8h and var9h and close/cost(8)<=0.7985
and (count(c=l,4)<3 or c>ref(c,1)))and pt or
var7 and var8 and var9 and close/cost(5)<=0.8 and
((var1>open or var1>ref(open,1) or
ref(var1,1)));
背离:=var2<ref(var2,1) and a>ref(a,1);
买入信号1:=var1>a and var2>b;
买入信号2:=b>a and 1>b and a<1 and h=hhv(h,21);
AAA:=BARSLAST(DISPSTATUS=1)+1;
LL:=LLV(L,AAA);
上涨:=BARSSINCE(BACKSET(DISPSTATUS=2,BARSLAST(L=LL)+1));
低:=REF(L,上涨);
F:=EMA(CLOSE,12)-EMA(CLOSE,26);
A:=EMA(F,9);
MMD:=2*(F-A);
STICKLINE(MMD<0 ,MMD+低,低,3,1) ,COLORFFFF00;
STICKLINE(MMD>=0 ,MMD+低,低,3,1) ,COLOR5050FF;
两周:=ALL(MMD<0,10);
十八天:=ALL(MMD<0,18);
STICKLINE(两周,MMD+低,低,3,1),COLOR00DDDD;
STICKLINE(十八天,MMD+低,低,3,1),COLORFF00FF;
MACD趋势:MMD,COLOR5050FF,linethick0;
QDIFF:低+F,COLORFFFFFF,linethick1,LAYER0;
PDEA:低+A,COLORYELLOW,linethick1,LAYER0;
var1:=CLOSE>REF(CLOSE,1) AND CLOSE>REF(CLOSE,2);


 现在就去充值积分
 加入VIP可下载100以下的所有资源